"How can we draw valid meaning from qualitative data? What
methods of analysis can we employ that are practical,
communicable, and non-self-deluding - in short, scientific in the
best sense of that word?"
Miles & Huberman [M&H], 1984, p. 15
Qualitative data are words rather than numbers. Words describe and explain. Words suggest new perspectives. Conclusions expressed as words seem more convincing than pages of numbers. But words are also ambiguous and difficult to compare objectively. It is never clear how much of a verbal description of one instance carries over to other instances. One observer's description, however precise, may not concur with another's. "It is easy for a qualitative researcher to jump to hasty, partial, unfounded conclusions" (M&H p. 21).
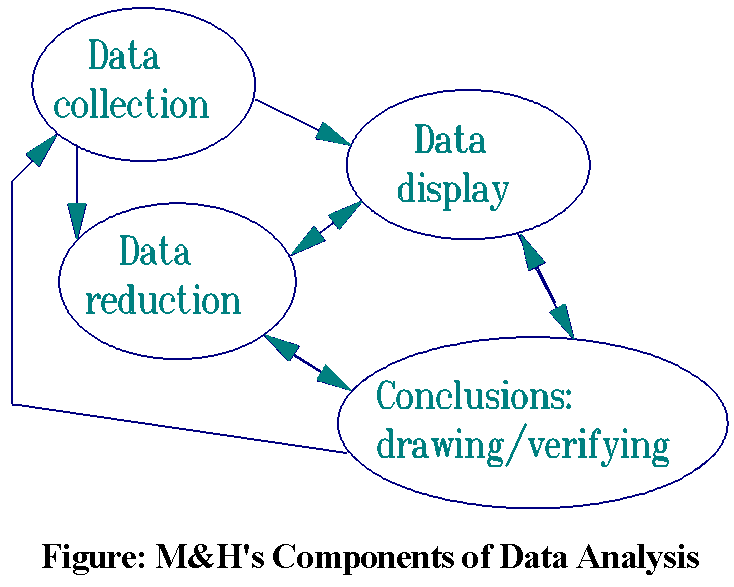
M&H propose a methodology for productive qualitative research that also provides a model for quantitative research. Their proposal is a useful guide to researchers who care about their research, whether labeled qualitative or quantitative. The Figure summarizes their approach. This iterative process of analysis does require more thought, and take more time, than off-the-shelf quantitative analysis, but is more likely to lead to useful and defensible findings.

The short-comings of conventional quantitative analysis are well known: "Hypothesis testing, while by far the most common statistical technique for generating conclusions from data, is nonetheless not very informative. It emphasizes a banal question `are two data-derived statistics identical?' whose answer is, in a mathematical sense, almost inevitably `No'. Hypothesis testing ignores two issues that are generally much more interesting, important and relevant: What is the pattern of the statistics, and what are their magnitudes of variability (standard errors, standard deviations). Plotting relevant statistics with their variability bars is a substantially better way of conveying the results of an experiment" (Loftus 1993).
Data display is a key element in M&H's qualitative methodology: "We have become convinced that better displays are a major avenue to valid qualitative analysis [and, according to Loftus, quantitative analysis]. All displays are designed to assemble and organize information in an immediately accessible, compact form, so that the analyst can see what is happening and either draw justified conclusions or move on to the next-step analysis which the display suggests may be useful. You know what you display" (M&H p. 21).
The major challenge in practical qualitative research is data reduction. "Everything looks important, especially at the outset, and the analyst wants to get it all." Ultimately, however, thousands of pages of interviews and observations must be reduced to a short report. Valid counting techniques are essential. Otherwise interesting, vivid or observer-preferred data distort the conclusions.
Yet the aversion of qualitative researchers to numbers is well known: "In qualitative research, numbers tend to get ignored. After all, the hallmark of qualitative research is that it goes beyond how much there is of something to tell us about is essential qualities. However there is a lot of counting going on when judgments of qualities are being made. When we identify a theme or pattern, we are isolating something that happens a number of times and consistently happens in a specific way. The moment we say something is `important' or `significant' or `recurrent', we have achieved that estimate in part by making counts, comparisons and weights" (M&H p. 215). But, they warn, "don't let the computations get unhinged from the raw data. Keep the words and the numbers or scales together throughout the analysis" (p. 174).
Rasch analysis helps qualitative researchers by: 1) aiding in the clear conceptualization and construction of unidimensional variables, 2) identifying useful rating scale categorizations, and 3) enabling qualitative results to be reduced (summarized) into simple metric forms for plotting and further analysis.

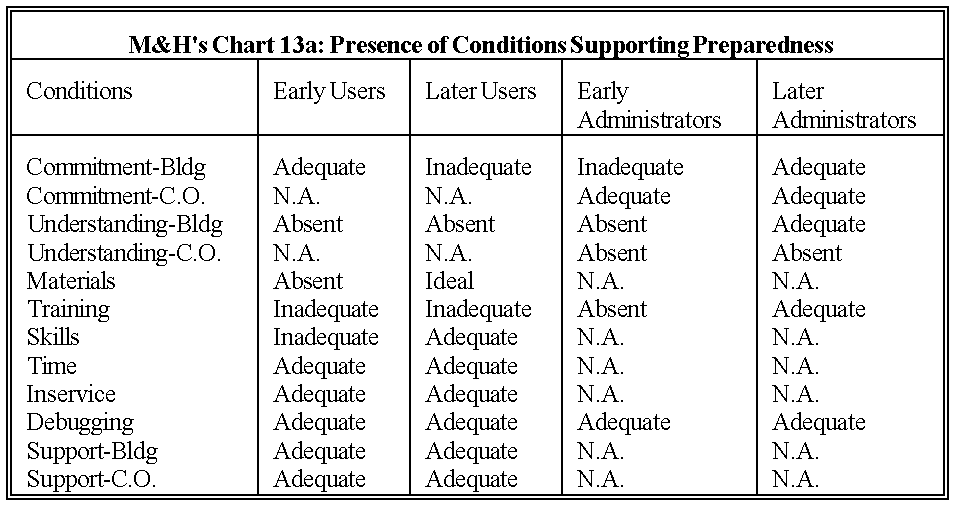
A Rasch analysis of M&H's Chart 13a (M&H p. 97) illustrates how Rasch analysis can simplify qualitative research. Four types of subjects are rated on 12 conditions with respect to preparedness. M&H's published chart is crammed with anecdotal information. An abbreviated Chart 13a is shown here. Even in this compressed version the reader is forced to pick and choose which cells to regard as important in order to form an overall impression of the situation.

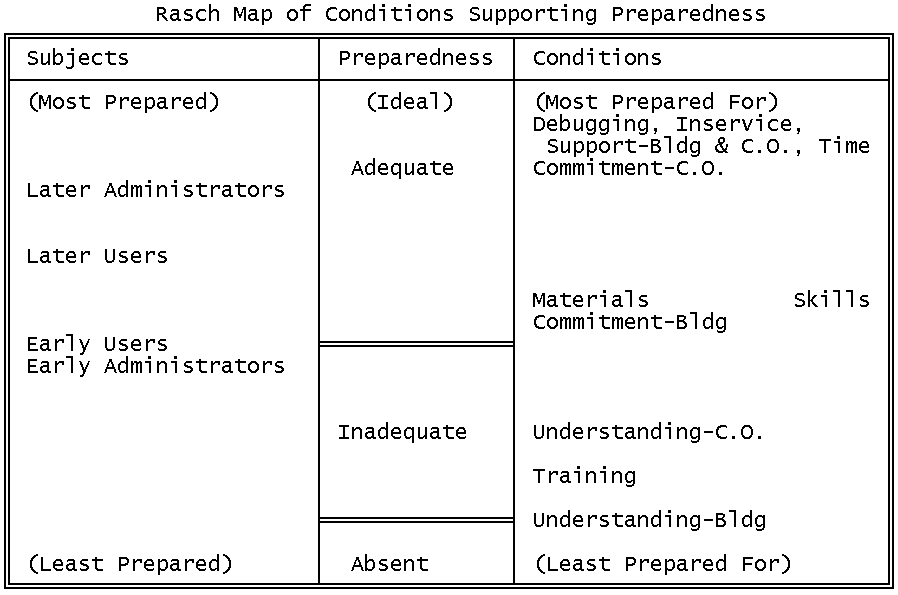
The Rasch Map summarizes the same data. It is a simple plot, based on a well-defined linear metric, in which the essential findings are brought together, clearly and unambiguously. It provides exactly the order and pattern which qualitative researchers are constantly searching for, as they strive to make sense of their data.
What about observations that buck the trend? No longer are these lost in the clutter. Rasch analysis detects and identifies exceptions. Now they are automatically reported for further consideration. "For any given finding, there are usually exceptions. The temptation is to smooth them over, ignore them, or explain them away. But the outlier is your friend. A good look at the exceptions, or the ends of a distribution, can test and strengthen the basic finding. It not only tests the generality of the finding, but protects against self-selecting biases. You need to find the outliers, then verify whether what is present in them is absent or different in other, more mainstream examples" (M&H p.237).
Loftus G.R. (1993) A picture is worth a thousand p values: On the irrelevance of hypothesis testing in the microcomputer age. Behavior Research Methods, Instruments and computers 25(2) 250- 256.
Miles M.B., Huberman A.M. (1984) Qualitative Data Analysis: A Sourcebook of New Methods. Newbury Park, CA: Sage
Learning from qualitative data analysis. Linacre, J.M. … Rasch Measurement Transactions, 1995, 9:1 p.405
| Forum | Rasch Measurement Forum to discuss any Rasch-related topic |
Go to Top of Page
Go to index of all Rasch Measurement Transactions
AERA members: Join the Rasch Measurement SIG and receive the printed version of RMT
Some back issues of RMT are available as bound volumes
Subscribe to Journal of Applied Measurement
Go to Institute for Objective Measurement Home Page. The Rasch Measurement SIG (AERA) thanks the Institute for Objective Measurement for inviting the publication of Rasch Measurement Transactions on the Institute's website, www.rasch.org.
| Coming Rasch-related Events | |
|---|---|
| Apr. 21 - 22, 2025, Mon.-Tue. | International Objective Measurement Workshop (IOMW) - Boulder, CO, www.iomw.net |
| Jan. 17 - Feb. 21, 2025, Fri.-Fri. | On-line workshop: Rasch Measurement - Core Topics (E. Smith, Winsteps), www.statistics.com |
| Feb. - June, 2025 | On-line course: Introduction to Classical Test and Rasch Measurement Theories (D. Andrich, I. Marais, RUMM2030), University of Western Australia |
| Feb. - June, 2025 | On-line course: Advanced Course in Rasch Measurement Theory (D. Andrich, I. Marais, RUMM2030), University of Western Australia |
| May 16 - June 20, 2025, Fri.-Fri. | On-line workshop: Rasch Measurement - Core Topics (E. Smith, Winsteps), www.statistics.com |
| June 20 - July 18, 2025, Fri.-Fri. | On-line workshop: Rasch Measurement - Further Topics (E. Smith, Facets), www.statistics.com |
| July 21 - 23, 2025, Mon.-Wed. | Pacific Rim Objective Measurement Symposium (PROMS) 2025, www.proms2025.com |
| Oct. 3 - Nov. 7, 2025, Fri.-Fri. | On-line workshop: Rasch Measurement - Core Topics (E. Smith, Winsteps), www.statistics.com |
The URL of this page is www.rasch.org/rmt/rmt91a.htm
Website: www.rasch.org/rmt/contents.htm