Racking and Stacking!
There is more at Rack and Stack: Time 1 vs. Time 2.
Measurement of change presents a nasty challenge. We expect persons (patients, students, experimental subjects) to change from Time 1 to Time 2. But the functioning of test items and rating scales may also change, even when identical data collection protocols are used. The challenge is to measure persons and items in the same clearly defined frame of reference encompassing both time points, so that measurements of change will have unambiguous numerical representation and substantive meaning.
Most analysts, including those misusing raw scores as measures, assume without verification that the functioning of test items and rating scales remains constant across time. The change-scores they report are spoiled by uncertain frames of reference.

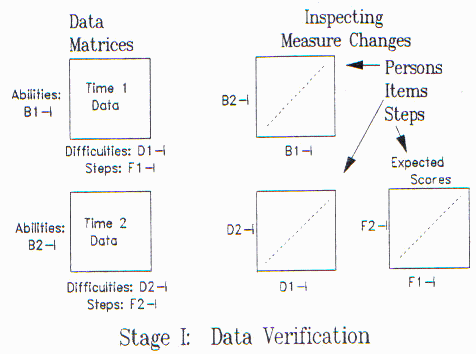
Rasch analysts proceed at least to Stage I (see Figure 1). Here the Time 1 and Time 2 data are analyzed independently. This aids the detection and elimination of gross errors in data entry and test administration. It also permits a rough verification of the stability of the frame of reference by plotting the item difficulty calibrations at Time 2 (D2-I) against those at Time 1 (D1-I). A close fit to the identity line is reassuring. For each rating scale, cross-plotting key points on the expected score ogives for Time 1 and Time 2 (derived from F1-I and F2-I) and then observing fit to the identity line verifies approximate scale stability. When these item and rating scale plots indicate stability, then the plot of ability measures for Time 2 (B2-I) against Time 1 (B1-I) provides a dependable picture of person changes.
Stage I, however, usually reveals problems. Some items are too far from the identity line. The rating scale structure is time dependent: at Time 1, upper categories may be rarely used; at Time 2, lower categories may be rarely used. The meaning of changes in person measures is now uncertain - further analysis is needed.

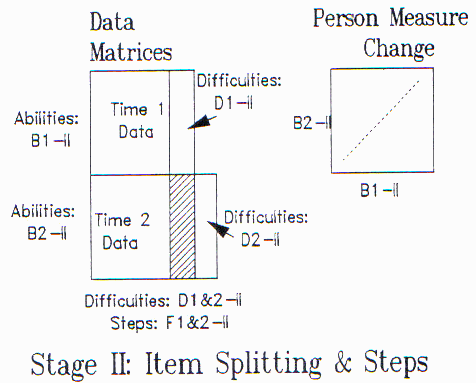
Stage II (see Figure 2) stacks the data vertically, so that each person appears twice (Time 1 and Time 2) and each item once. This Stage is independent of Stage I. Nothing is anchored. This Stage II matrix yields three findings:
a) Items that were away from the identity line in Stage I now show greater misfit than in the separate Stage I analyses. This confirms that these items function differently at the two time- points, and suggests that each such item might be "split" into two separate items: a Time 1 version and a Time 2 version. The column of item responses can be split into two columns (with missing data at the other time point) so that the two time-interacting versions of each original item are calibrated independently. Re-analysis should show an overall improvement in fit and an increase in person separation.
b) The rating scale calibrations used for the final item structure are those most consistent with both Time 1 and Time 2. These become the anchor calibrations (F1&2-II) for later analyses.
c) Each person is estimated with two abilities. Plotting Time 2 abilities (B2-II) against Time 1 abilities (B1-II) at Stage II is more meaningful than Stage I. But even these measures are still in an intermediate frame of reference that reflects neither Time 1 nor Time 2 accurately.

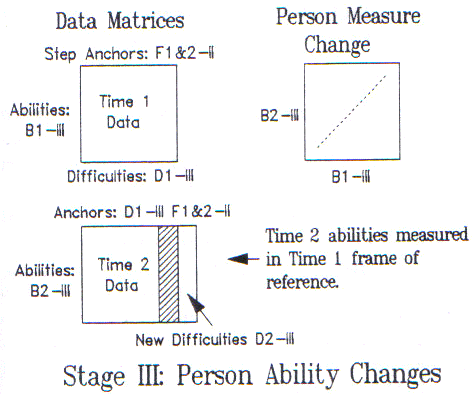
Stage III (see Figure 3) installs Time 1 as the benchmark. We measure change away from Time 1. (Time 2 can also be treated as a benchmark.) Benchmark item calibrations (D1-III) and person measures (B1-III) are obtained from the Time 1 data using the F1&2-II calibrations as step anchors. The D1-III and F1&2-II calibrations are now applied to the Time 2 data, except for the Time 2 occurrence of "split" items which float. The Time 2 person measures (B2-III) and the Time 2 calibrations for split items (D2-III) have now been estimated in the Time 1 frame of reference. The same ruler has been applied at Time 1 and Time 2. The plot of B2-III against B1- III, along with the change measures (B2-III - B1-III), are now in an unambiguously defined Time 1 frame of reference.

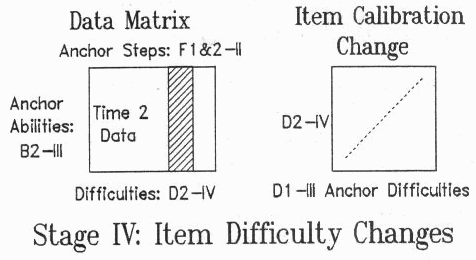
In Stage III, the change from Time 1 to Time 2 is expressed as changes in person measures. There have also been changes in item functioning. To examine these, in Stage IV, perform a further analysis of the Time 2 data. Anchor person measures at B2-III, their Stage III values in the Time 1 frame of reference. Keep step calibrations (F1&2-II) anchored. Local Time 2 item calibrations (D2-IV) can now be obtained in the Time 1 frame of reference. These calibrations make explicit the item changes from Time 1 to Time 2 that were implicit in the changes of person measures. A plot (Fig. 4) of D2-IV against D1-III (including split items) displays the changes in item difficulty across time, again in a clearly defined frame of reference.
Racking and Stacking
Racking refers to placing Time 1 and Time 2 data together horizontally. This is can replace Stage 4 above (but can also be done without anchoring). Persons are considered to be unchanged, but the items to move between Time 1 and Time 2. This investigates what the impact of the intervention is on the difficulty of each item from the sample's perspective. Those item which have been "taught to" usually get easier than those which have not. Some items may even get harder due to the intervention, or the passing of time.
Stacking refers to placing Time 1 and Time 2 data together vertically. This is equivalent to Stage 3 above (but can also be done without anchoring). Items are considered to be unchanged, but the persons to move between Time 1 and Time 2. This investigates what the impact of the intervention is on the ability of each person from the test's perspective.
Time 1 to Time 2 (Pre-test to Post-test) comparison: Racking and Stacking. Wright BD. … Rasch Measurement Transactions, 1996, 10:1 p.478
| Forum | Rasch Measurement Forum to discuss any Rasch-related topic |
Go to Top of Page
Go to index of all Rasch Measurement Transactions
AERA members: Join the Rasch Measurement SIG and receive the printed version of RMT
Some back issues of RMT are available as bound volumes
Subscribe to Journal of Applied Measurement
Go to Institute for Objective Measurement Home Page. The Rasch Measurement SIG (AERA) thanks the Institute for Objective Measurement for inviting the publication of Rasch Measurement Transactions on the Institute's website, www.rasch.org.
| Coming Rasch-related Events | |
|---|---|
| Apr. 21 - 22, 2025, Mon.-Tue. | International Objective Measurement Workshop (IOMW) - Boulder, CO, www.iomw.net |
| Jan. 17 - Feb. 21, 2025, Fri.-Fri. | On-line workshop: Rasch Measurement - Core Topics (E. Smith, Winsteps), www.statistics.com |
| Feb. - June, 2025 | On-line course: Introduction to Classical Test and Rasch Measurement Theories (D. Andrich, I. Marais, RUMM2030), University of Western Australia |
| Feb. - June, 2025 | On-line course: Advanced Course in Rasch Measurement Theory (D. Andrich, I. Marais, RUMM2030), University of Western Australia |
| May 16 - June 20, 2025, Fri.-Fri. | On-line workshop: Rasch Measurement - Core Topics (E. Smith, Winsteps), www.statistics.com |
| June 20 - July 18, 2025, Fri.-Fri. | On-line workshop: Rasch Measurement - Further Topics (E. Smith, Facets), www.statistics.com |
| July 21 - 23, 2025, Mon.-Wed. | Pacific Rim Objective Measurement Symposium (PROMS) 2025, www.proms2025.com |
| Oct. 3 - Nov. 7, 2025, Fri.-Fri. | On-line workshop: Rasch Measurement - Core Topics (E. Smith, Winsteps), www.statistics.com |
The URL of this page is www.rasch.org/rmt/rmt101f.htm
Website: www.rasch.org/rmt/contents.htm