Choices of category designations for rating scales vary widely. Sometimes each category is clearly labeled: "strongly disagree", "disagree", "agree", "strongly agree". At other times there is minimal identification: "on a scale from 1 to 10, how much do you like ...". When constructing a rating scale, our intention is to define a clear ordering of response levels that are used by respondents in parallel with the underlying variable. However, for many reasons people respond differently from the way we intended. We may have given more categories than they can distinguish, or they may respond using multiple dimensions. How can we check that they have responded according to the intended ordering?
A Rasch model for rating scale data takes the form
loge (Pnik/Pnik-1) = Bn - Di - Fk
where Bn is the location of the person on the latent variable, Di is the location of the item, and Fk the location of the boundary or threshold on the continuum between category k and category k-1. When (Bn - Di) corresponding to all observations in category k in the data are averaged, the average measure Ak is obtained. Since a response in a higher category implies being further along the variable, it has been suggested that a criterion for category utility is that the average measures have the same order as the categories (RMT 9:3 p. 450-451). Examine Table 1 below.
    Table 1.  Disordered Thresholds
Category  Observed   Average     Threshold
Label k   Count %    Measure Ak     Fk
1          32%         -0.7
2          15%         -0.5         0.2
3          26%         -0.1        -0.9
4          11%          0.1         0.9
5          16%          0.3        -0.2
The average measures increase with the category score - suggesting that the rating scale categorization is satisfactory. But other evidence contradicts this: the Observed Count % indicates that odd categories are chosen more often than even, irrespective of location. A manifestation of this is that the thresholds Fk between the categories are disordered.
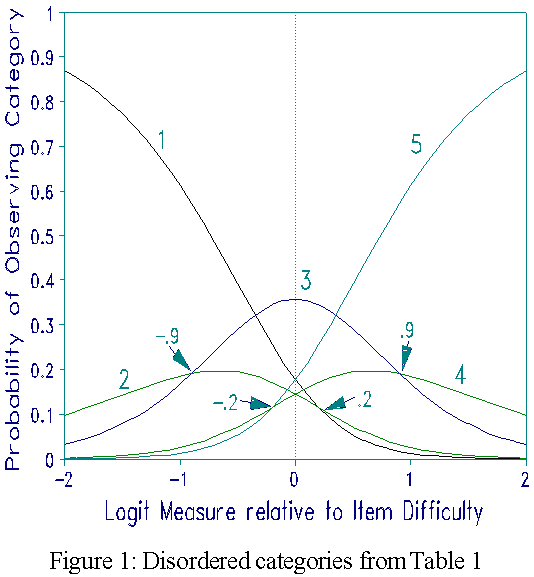
Recall that the Fk are parameters located on the continuum. They indicate the measures at which adjacent categories are equally probable and thus define the boundaries between the categories. Therefore, they too should be ordered and increase along the continuum. But thresholds from the data in Table 1 do not show such an order. The second one, -0.9, has a lower value than the first, 0.2, and the fourth, -0.2, has a lower value than the third, 0.9. Another manifestation of the lack of order is that the response curves in Figure 1 (which corresponds to Table 1) do not show a natural progression. We usually intend that as Bn-Di increases, each successive category in turn will become most probable. Figure 1 shows that this is not the case. Thus Table 1 shows a mathematically possible, but interpretatively inconsistent result.

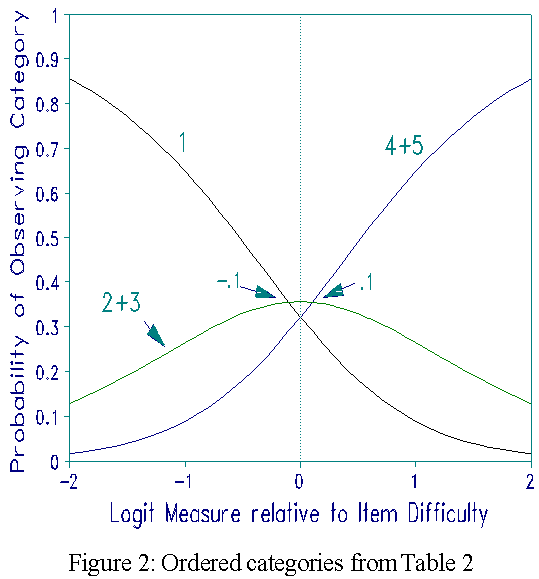
If two categories were indistinguishable for people, that is in reality there is no threshold or boundary between them, but we try to estimate a hypothetical one, then that threshold will tend to have a smaller value than the previous threshold. This is because in reality the second of the two categories is not as high up the scale as we hypothesized by our scoring - we gave it too big a score and the threshold estimate is lower to compensate for it. In Table 1 this suggests that categories 2 and 3 should be combined and categories 4 and 5 likewise. Thus, in reality only three categories are working properly, even though it was intended that there should be five. Table 2 shows the combined data and shows ordered values of Fk. Figure 2, corresponding to Table 2, shows the required progression of the category response curves.
       Table 2.  Ordered Thresholds
Category     Observed    Average     Threshold
Label k      Count %     Measure Ak  Fk
1             32%         -0.5
2+3           41%          0.0       -0.1
4+5           37%          0.4        0.1

There are two further points to note. First, the Tables show observed counts across people. It is possible for the percentages of people in any category to show any kind of pattern with the thresholds still showing the correct order. Alternatively, the percentages across people may have a reasonable pattern, and the thresholds can be disordered. This is because the response probabilities in the model pertain to the manifest rating of a single person to a single item. In the estimate of the item parameters, both the Di and the Fk, the person parameter Bn is effectively eliminated. The estimate of the location of the Fk is independent of the distribution of persons, and the ordering of the thresholds Fk pertains to the rating of each person on each item. However, percentages of responses of persons in each category depend on the distribution of the persons. The location of the thresholds independently of the location of the persons (as it is in the Rasch model) is an essential requirement for determining the working of the categories at the level of the individual person. Second, with the thresholds in the correct order as in Table 2, and if all other evidence pointed to the data fitting the model, then no further categories should be combined. If they were combined, the data would fit the Rasch model worse with two categories than they fit the model with three categories. These issues are elaborated in the references below.
Andrich, D. (1979) A model for contingency tables having an ordered classification. Biometrics 35(2) 403-415.
Andrich, D. (1988) A general form of Rasch's extended logistic model. Applied Measurement in Education, 1, 363-378.
Andrich, D. (1996) Measurement criteria for choosing among models for graded responses. In A. von Eye and C. C. Clogg (Eds.) Analysis of categorical variables in developmental research. Orlando FL: Academic Press. Chapter 1, 3-35.
Category ordering and their utility. Andrich DA. … Rasch Measurement Transactions, 1996, 9:4 p.464
| Forum | Rasch Measurement Forum to discuss any Rasch-related topic |
Go to Top of Page
Go to index of all Rasch Measurement Transactions
AERA members: Join the Rasch Measurement SIG and receive the printed version of RMT
Some back issues of RMT are available as bound volumes
Subscribe to Journal of Applied Measurement
Go to Institute for Objective Measurement Home Page. The Rasch Measurement SIG (AERA) thanks the Institute for Objective Measurement for inviting the publication of Rasch Measurement Transactions on the Institute's website, www.rasch.org.
| Coming Rasch-related Events | |
|---|---|
| Jan. 16 - Feb. 13, 2025, Fri.-Fri. | On-line workshop: Rasch Measurement - Core Topics (E. Smith, Winsteps), www.statistics.com |
| Apr. 8 - Apr. 11, 2026, Wed.-Sat. | National Council for Measurement in Education - Los Angeles, CA, ncme.org/events/2026-annual-meeting |
| Apr. 8 - Apr. 12, 2026, Wed.-Sun. | American Educational Research Association - Los Angeles, CA, www.aera.net/AERA2026 |
| May. 15 - June 12, 2026, Fri.-Fri. | On-line workshop: Rasch Measurement - Core Topics (E. Smith, Winsteps), www.statistics.com |
| June 19 - July 25, 2026, Fri.-Sat. | On-line workshop: Rasch Measurement - Further Topics (E. Smith, Winsteps), www.statistics.com |
The URL of this page is www.rasch.org/rmt/rmt94f.htm
Website: www.rasch.org/rmt/contents.htm