Science depends on theory, imagination and memory in a continuous dialogue with experience. This dialog flows from the initiating idea, with which each scientific adventure begins, through a focusing of the idea into a variable of one varying magnitude. The variable requires an articulation bench-marking the variable's emerging line of inquiry into an itemization of operations by which manifestations of the variable may be observed, counted, stochastically ordered, and so used to construct measures.
Scientific understanding of a phenomenon requires the construction of a theory. This theory is the basis for predicting, manipulating, controlling and counteracting the phenomenon, and also for relating the phenomenon to other phenomena. The construction of theory requires the careful selection of data. In astronomy, Tycho Brahe's careful planetary observations enabled first the geometric theories of Johanes Kepler and then the dynamic theory of Isaac Newton. In the social sciences, we still linger at the early stage of seeking ways to select useful data.
But theory construction from observations can already be realized. Much useful data has been carefully recorded. Analysis of these data, however, has been merely descriptive. Theory-construction has tended to degenerate into speculation on accidental features of the data and reinforcement of preconceptions.
A strong theory implies structure in data despite the inevitable vagaries inherent in all observations. Rasch measurement detects and quantifies the details of data structure whenever structure exists. The metric realization of the structure provides a foundation for theory construction. Every piece of data confirms or challenges the theory. Further, the presence of structure invites the researcher to extrapolate, to predict extensions which can be confirmed or refuted by further data collection.
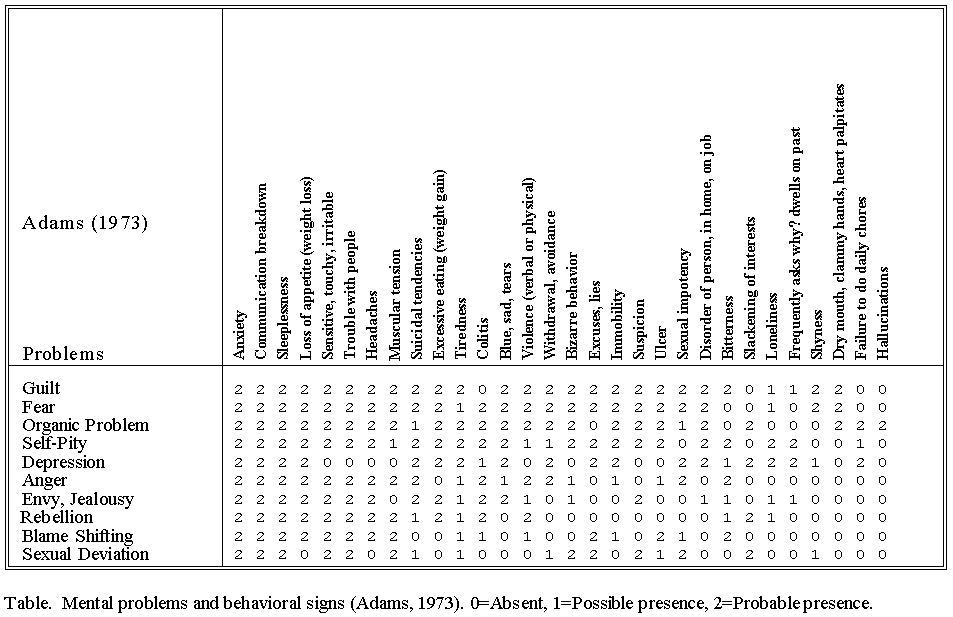
This kind of theory construction is illustrated by an analysis of the "Signs of Ten Common Problems" (Adams, 1973) in the Table. Adams notes that certain behavioral "Signs" are often exhibited by individuals with certain psychological "Problems". He reports his data as a counselling aid, but not as a basis for theory.

For theory development, however, the initiating idea is mental health. Mental health is focused into a variable: degree of mental illness. This variable is articulated by 10 mental problems. Finally these ten problems are itemized into 30 behavioral signs by which the mental problems might be identified and thence mental illness measured. The crucial question at this point of theory development is: Do these ten problems and these 30 signs relate to one another in a pattern sufficiently singular to enable the construction of a single variable of mental illness?
Delightfully, Rasch analysis of Adams' data uncovers a conjoint ordering of Signs and Problems. Signs are ordered from those observed most frequently with many Problems to those observed least frequently with few Problems. Problems are ordered from those with the most Signs observed most frequently to those with the fewest signs observed least frequently. Since these two orderings are found to be compatible, the data exhibits structure, and each of the Signs and Problems can be placed in a single linear measurement system, enabling the mathematical expression of their relationships. The degree to which each Sign and each Problem coordinate in the structure can be evaluated by statistical quality control.

The measures for Signs are reported in the adjacent Table. Three Signs, "Communication Breakdown", "Sleeplessness", and "Anxiety" are present for all problems. "Hallucinations" is present with only one Problem. These measures locate the Signs on an underlying linear variable of mental illness, with each location having a precision given by its standard error.
The degree to which each Sign coordinates in defining the structure is given by its quality-control mean-square fit statistic (Fit MnSq in Table). Each mean-square has an expectation of 1. Mean-squares substantially larger than 1 indicate Problem patterns for a Sign that are not in accord with the general structure.
The most noticeable misfit of 2.16 is associated with "Slackening of Interests." An individual exhibiting "Sexual Deviation" may have a slackening of normal interests, but is far from apathetic. This implies how the structure could be clarified and strengthened, and the utility of the Table increased, by redefining "Slackening of interests" into two Signs, "Lack of activity" and "Misdirected activity."
A similar analysis of Problems (see Table) discloses "Guilt" as the problem that exhibits the most signs, while "Blame Shifting" and "Sexual Deviation" exhibit the least. The large misfit for "Depression" indicates that it may be a nebulous problem, reflecting a general frame of mind, rather than a specific diagnosis.
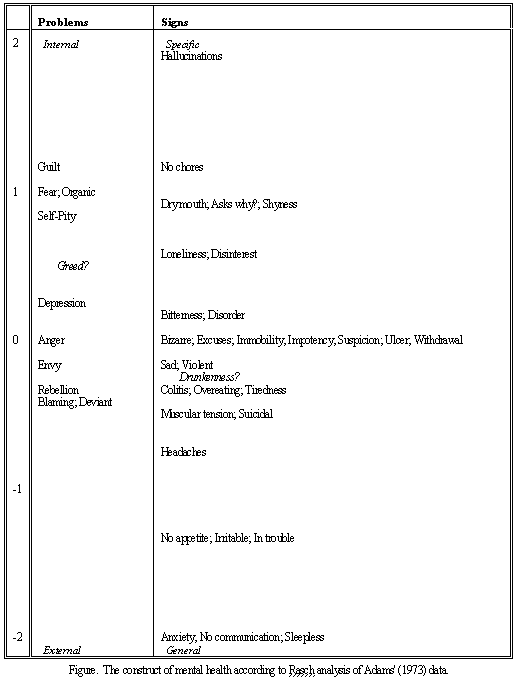
In using Rasch results to construct theory, a visual representation of the measurement system is decisive (see Figure opposite). Adams' Problems mark out a spectrum ranging from internalized stress at the top of the Figure down through externally-expressed emotional stress to externally-expressed physical stress, with the externalized behavior exhibiting more symptoms at the bottom. His Signs show a trend from the more frequently observed, polite neuroses at the bottom of the Figure, up through self-destructive symptoms, to anti-social symptoms, climaxing with the autistic extreme of "Hallucinations."
Rasch analysis of Adams' data suggests the theory that as psychological problems become more anti-social and dynamic, there are more socially-overt symptoms, but as the problems increase to psychosis, the symptoms of more introvert problems are still observed.
These conclusions may be thought self-evident by practitioners. Nevertheless, it is the precise expression of such knowledge that enables scientific advance. With this theory, for instance, one can predict where uncategorized Signs, such as drunkenness and drug abuse should appear. A likely location is between "Violence" and "Over- eating." Unlisted Problems such as "Greed" or "Avarice" should appear between "Self-Pity" and "Anger."
The Rasch technique develops a quantitative framework for the data. Inspection of the placement of the Problems and Signs facilitates the development of an explanatory and predictive theory for data structure. This phase of theory construction, however, still falls short of predicting measures for further Problems or Signs. Though that phase was long ago reached in the physical sciences, it is only now being approached in just a few social science areas, such as in predicting the reading difficulty of a text passage (Stenner et al. 1987).
Adams J.E. 1973. The Christian Counselor's Manual. Grand Rapids, MI: Zondervan
Stenner AJ, Smith M, Horabin I, Smith DR. 1987. Lexile Test of Reading Comprehension. Durham NC: Metametrics.
Raw    Measure  S.E.  Fit  Behavioral Sign
Score                MnSq
                             Associated with few Problems
 2       1.93   .63  1.26  Hallucinations
 5       1.13   .45  1.20  Failure to do daily chores
 6        .94   .43   .71  Dry mouth, clammy hands, heart palpitates
 6        .94   .43  1.17  Frequently asks why? dwells on past
 6        .94   .43   .85  Shyness
 8        .60   .40   .90  Loneliness
 8        .60   .40  2.16  Slackening of interests
11        .13   .39  1.42  Bitterness
11        .13   .39   .55  Disorder of person, in home, on job
12       -.03   .40   .73  Bizarre behavior
12       -.03   .40  1.49  Excuses, lies
12       -.03   .40   .49  Immobility
12       -.03   .40  1.25  Sexual impotency
12       -.03   .40  1.08  Suspicion
12       -.03   .40   .79  Ulcer
12       -.03   .40   .68  Withdrawal, avoidance
13       -.19   .40   .65  Blue, sad, tears
13       -.19   .40   .83  Violence (verbal or physical)
14       -.35   .42  1.19  Colitis
14       -.35   .42   .99  Excessive eating (weight gain)
14       -.35   .42   .21  Tiredness
15       -.54   .44  1.41  Muscular tension
15       -.54   .44   .60  Suicidal tendencies
16       -.74   .47  1.31  Headaches
18      -1.31   .63  1.21  Loss of appetite (weight loss)
18      -1.31   .63  1.52  Sensitive, touchy, irritable
18      -1.31   .63  1.52  Trouble with people
20      -2.40  1.27   -    Anxiety
20      -2.40  1.27   -    Communication breakdown
20      -2.40  1.27   -    Sleeplessness
                             Associated with many Problems
|
Raw   Measure  S.E.  Fit   Mental Problem
Score                MnSq
                             with more Signs
44       1.18   .32   .90  Guilt
42        .99   .29   .87  Fear
42        .99   .29  1.45  Organic Problem
40        .83   .28   .84  Self-Pity
31        .22   .25  1.92  Depression
27       -.02   .24   .66  Anger
25       -.14   .24   .69  Envy, Jealousy
22       -.31   .25   .80  Rebellion
21       -.38   .25   .76  Blame Shifting
21       -.38   .25  1.24  Sexual Deviation
                             with less Signs
|
Theory construction from empirical observations. Wright BD. … Rasch Measurement Transactions, 1994, 8:2 p.362
| Forum | Rasch Measurement Forum to discuss any Rasch-related topic |
Go to Top of Page
Go to index of all Rasch Measurement Transactions
AERA members: Join the Rasch Measurement SIG and receive the printed version of RMT
Some back issues of RMT are available as bound volumes
Subscribe to Journal of Applied Measurement
Go to Institute for Objective Measurement Home Page. The Rasch Measurement SIG (AERA) thanks the Institute for Objective Measurement for inviting the publication of Rasch Measurement Transactions on the Institute's website, www.rasch.org.
| Coming Rasch-related Events | |
|---|---|
| Jan. 16 - Feb. 13, 2025, Fri.-Fri. | On-line workshop: Rasch Measurement - Core Topics (E. Smith, Winsteps), www.statistics.com |
| Apr. 8 - Apr. 11, 2026, Wed.-Sat. | National Council for Measurement in Education - Los Angeles, CA, ncme.org/events/2026-annual-meeting |
| Apr. 8 - Apr. 12, 2026, Wed.-Sun. | American Educational Research Association - Los Angeles, CA, www.aera.net/AERA2026 |
| May. 15 - June 12, 2026, Fri.-Fri. | On-line workshop: Rasch Measurement - Core Topics (E. Smith, Winsteps), www.statistics.com |
| June 19 - July 25, 2026, Fri.-Sat. | On-line workshop: Rasch Measurement - Further Topics (E. Smith, Winsteps), www.statistics.com |
The URL of this page is www.rasch.org/rmt/rmt82h.htm
Website: www.rasch.org/rmt/contents.htm