Short, cheap screening tests are used to tell which examinees must take time-consuming, expensive tests. A good screening test distributes resources efficiently. A poor screening test wastes examinee time and lowers testing efficiency.

Colliver, Vu and Barrows (CVB), in AERA (Division I) award-winning research, evaluate the screening effectiveness of a standardized patient (SP) examination for medical clerkship by means of Receiver Operating Characteristic (ROC) signal detection. All CVB students took the 3 day examination of 18 SP cases. CVB consider using the first day to screen the next two days. They want to minimize testing effort for clear passes, so they investigate how results differ when a pass on the first day is accepted as a pass on all three days, but a fail on the first day requires the next two days. CVB's "true positive" success rate is the proportion of examinees passing the full examination who pass the screening test. The higher the "true positive" rate, the more resources are saved by the screening test. Their "false positive" failure rate is the proportion of examinees failing the full examination who pass the screening test. The lower the "false positive rate", the fewer unqualified students are passed.
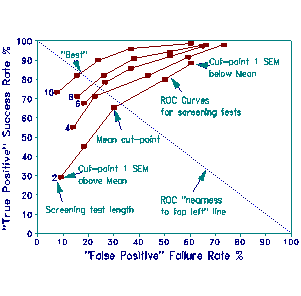
Empirical "true positive" and "false positive" rates for screening tests of 2, 4, 6, 8, and 10 standardized patients are reported by CVB in ROC format (ROC Rate % plot). Each curve describes the ROC of a screening test. The five points along each curve mark 5 pass-fail cut-points. From lower left to upper right of each curve, these cut-points range from one standard error of measurement (SEM) above the mean pass-fail level of the SP cases in the screening test to one SEM below. The center point marks a cut-point at the mean. ROC curves are interpolated by straight lines between these five points.
In principle, the closer a ROC curve is to the top left, the better the screening test, i.e., longer tests are better. The best cut-point for a test is a point near the top left, where the "true positive" rate is much greater than the "false positive" rate. This is usually close to the cut-point corresponding to 0.5 SEM above the screening test's mean SP pass-fail level.

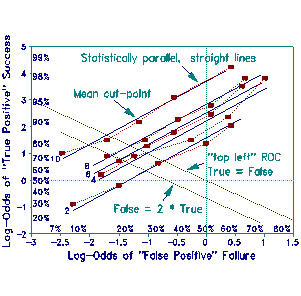
Unfortunately, ROC curves are in a non-linear % metric. Consequently it is difficult to "measure" distances between ROC curves or to calculate how much "nearness" costs in terms of extra SP cases administered. The ROC curves, however, can be linearized by converting them to log-odds (Log-Odds plot). Now the ROC curves are seen to be empirical manifestations of parallel straight lines that relate success on the screening test to success on the full test in a simple way. The unequal spacing of the 5 cut-points across tests exposes the arbitrariness of cut-points based on SP (or item) distribution.
The line nearest top left is the "best" test, and the "best" cut-point has not changed. Nevertheless, the misleading geometry of the ROC plot is exposed. Now there are many reasonable "nearness" rules. Any diagonal line, top-left to bottom-right, could suffice.
The ROC rule specifies that credit for correct selection and debit for incorrect selection are equal. But this is seldom so. For the screening test that CVB describe, the penalty for a "false positive" (passing an incompetent examinee) is much greater than the benefit for a "true positive" (shorter test administration for a competent examinee). Otherwise the test would long since have been shortened. An Examination Board's preferred trade-off between debits and credits can be expressed by "best" cut-point contours on either plot. But the log-odds plot has important advantages over the ROC plot: 1) Screening test lines are parallel, straight and easily extrapolated. 2) Reasonable lines for screening tests of other lengths are simple to interpolate between the existing lines. 3) Alternative "nearness" rules can be expressed and evaluated as simple straight lines. One is shown for when the Board specifies that the penalty for passing an unqualified candidate is twice the benefit for passing a qualified candidate on the screening test.
John Michael Linacre
Colliver JA, Vu NV, Barrows HS. Screening test length for sequential testing with a standardized-patient examination: a Receiver Operating Characteristic (ROC) analysis. Academic Medicine, 67(9) 592-595, September 1992
Evaluating a ROC screening test. Linacre JM. Rasch Measurement Transactions 1994 7:4 p.317-8
Evaluating a screening test. Linacre JM. … Rasch Measurement Transactions, 1994, 7:4 p.317-8
| Forum | Rasch Measurement Forum to discuss any Rasch-related topic |
Go to Top of Page
Go to index of all Rasch Measurement Transactions
AERA members: Join the Rasch Measurement SIG and receive the printed version of RMT
Some back issues of RMT are available as bound volumes
Subscribe to Journal of Applied Measurement
Go to Institute for Objective Measurement Home Page. The Rasch Measurement SIG (AERA) thanks the Institute for Objective Measurement for inviting the publication of Rasch Measurement Transactions on the Institute's website, www.rasch.org.
| Coming Rasch-related Events | |
|---|---|
| Jan. 16 - Feb. 13, 2025, Fri.-Fri. | On-line workshop: Rasch Measurement - Core Topics (E. Smith, Winsteps), www.statistics.com |
| Apr. 8 - Apr. 11, 2026, Wed.-Sat. | National Council for Measurement in Education - Los Angeles, CA, ncme.org/events/2026-annual-meeting |
| Apr. 8 - Apr. 12, 2026, Wed.-Sun. | American Educational Research Association - Los Angeles, CA, www.aera.net/AERA2026 |
| May. 15 - June 12, 2026, Fri.-Fri. | On-line workshop: Rasch Measurement - Core Topics (E. Smith, Winsteps), www.statistics.com |
| June 19 - July 25, 2026, Fri.-Sat. | On-line workshop: Rasch Measurement - Further Topics (E. Smith, Winsteps), www.statistics.com |
The URL of this page is www.rasch.org/rmt/rmt74a.htm
Website: www.rasch.org/rmt/contents.htm