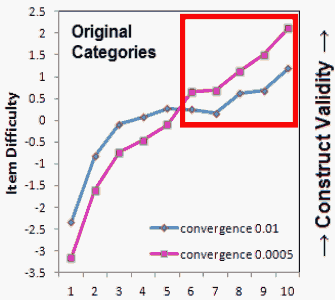
Figure 1. Item locations with original categories, including unobserved categories.

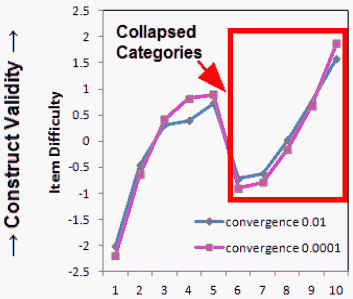
Figure 2. Item locations with unobserved extreme categories collapsed with neighboring categories
While analyzing a dataset of 10 polytomous partial-credit items, I found that the estimates of item difficulties and their ordering varied depending on the convergence limits set for estimation. The ordering is important because it is used as evidence for the construct validity of the instrument. In my investigation, the item locations were calibrated twice. Once with the item convergence limits set at 0.01 and again at 0.0005. The sample size was 6,520 and the person ability distribution was roughly normal.
Figure 1 is a graphical presentation of the differences between item locations at the two convergence limits. As expected, the tighter (smaller) convergence limit resulted in more dispersed item difficulty estimates. The location differences between convergence at 0.01 and convergence at 0.0005 are surprisingly large. The absolute values of the differences vary from 0.38 to 0.92 logits. What could be the reason?
When category frequencies were examined, it was found that items 6-10 had no observations in their extreme highest categories (see Table 1). These had been automatically accommodated by my RUMM2030 analysis. To examine the impact of the unobserved categories on the item locations, the unobserved extreme category 5s were combined with their adjacent category 4s. After collapsing those extreme categories, the item locations were again estimated twice with convergence limits at 0.01 and more tightly at 0.0001.
Figure 2 shows the resulting item estimates. Compared with the estimates in Figure 1, the location differences for each item at the two convergence limits are much smaller. This time, the absolute differences varied from 0.10 to 0.42 logits. Although, there were no changes made to items 1-5, the location differences for most of these items also reduced between the two convergence limits. The difference for item 4 remained somewhat large, perhaps because item 4 has only 1 observation in category 4, its top category, making estimation of its difficulty location less stable.
As expected, the items with collapsed categories, items 6-10, have become relatively easier than in the first, uncollapsed analysis. This is because the definition of item difficulty is "the location on the latent variable at which the top and bottom categories are equally probable." Collapsing the two highest categories for each item has moved the combined top category toward the middle of the original rating scale, and so moved the item location down the latent variable.
In conclusion, these analyses indicate that convergence limits should be set tightly enough to be substantively stable. These analyses also show that collapsing categories can make conspicuous changes to the item difficulty hierarchy. If categories are collapsed and the item hierarchy must be maintained for measure interpretation and construct validity, then pivot-anchoring (RMT 11:3 p. 576-7) may be required.
Edward Li
 Figure 1. Item locations with original categories, including unobserved categories. |
 Figure 2. Item locations with unobserved extreme categories collapsed with neighboring categories |
| ||||||||||||||||||||||||||||||||||||||||||||||||||||||||||||||||||
| Table 1. Original category frequencies of the data Note: # this unobserved category collapsed with adjacent category in the second analysis. |
Convergence, Collapsed Categories and Construct Validity. Edward Li ... Rasch Measurement Transactions, 2012, 25:4, 1339
| Forum | Rasch Measurement Forum to discuss any Rasch-related topic |
Go to Top of Page
Go to index of all Rasch Measurement Transactions
AERA members: Join the Rasch Measurement SIG and receive the printed version of RMT
Some back issues of RMT are available as bound volumes
Subscribe to Journal of Applied Measurement
Go to Institute for Objective Measurement Home Page. The Rasch Measurement SIG (AERA) thanks the Institute for Objective Measurement for inviting the publication of Rasch Measurement Transactions on the Institute's website, www.rasch.org.
| Coming Rasch-related Events | |
|---|---|
| Jan. 16 - Feb. 13, 2025, Fri.-Fri. | On-line workshop: Rasch Measurement - Core Topics (E. Smith, Winsteps), www.statistics.com |
| Apr. 8 - Apr. 11, 2026, Wed.-Sat. | National Council for Measurement in Education - Los Angeles, CA, ncme.org/events/2026-annual-meeting |
| Apr. 8 - Apr. 12, 2026, Wed.-Sun. | American Educational Research Association - Los Angeles, CA, www.aera.net/AERA2026 |
| May. 15 - June 12, 2026, Fri.-Fri. | On-line workshop: Rasch Measurement - Core Topics (E. Smith, Winsteps), www.statistics.com |
| June 19 - July 25, 2026, Fri.-Sat. | On-line workshop: Rasch Measurement - Further Topics (E. Smith, Winsteps), www.statistics.com |
The URL of this page is www.rasch.org/rmt/rmt254a.htm
Website: www.rasch.org/rmt/contents.htm