Traditionally, admission's testing programs have provided admissions committees with little more than standard scores and an overall standard error of measurement for individual tests and, in some cases, an overall average to assist in the admissions process. The number of correct answers that lead to that score is generally not available nor is the individual response pattern available.
Supplemental Score Reports (SSRs) are designed to provide admissions committees with a variety of information about the results of the individual tests contained in the test batteries. This information can be used in determining the extent to which the reported total test standard scores are a fair representation of each applicant's abilities.
Rasch-based Fit Reporting
Thus SSRs provide a variety of information and summary statistics about an applicant's performance. The majority of the information is available only through the use of the Rasch model, rather than the "true-score", i.e., raw-score model. The Rasch model provides estimates of the person ability and the item difficulty on a common metric through the use of the total person and item scores as sufficient statistics. The precision of each estimate is defined by its own standard error.
The existence of the common metric provides the opportunity to combine the person ability and item difficulty to predict the person's performance on any item, and to identify unexpected responses. The differences between the observed and predicted performance are the basis for the response pattern analysis. The person fit statistics, identified as quality indices on the SSRs, are a direct evolution of the item fit statistics first proposed by Wright and Panchapakesan (1969).
Why Report Person Measure disturbance?
It may be argued that in highly competitive admissions programs, where the purpose of the test is to assist in selecting the top 1/3 to 1/4 of the applicants, little attention need be paid to the large number of measurement disturbances that can effect an applicant's performance on a standardized test.
The Division of Educational Measurements of the American Dental Association administers the Dental Admission Test (DAT), the Optometry Admission Test (OAT), and the Canadian Dental Aptitude Test (CDAT). Recently the Division instituted a program of issuing Supplemental Score Reports (SSR) to all institutions that use the results of these three testing programs in making admissions decisions.
In the mid 1970's the primary purpose of the DAT battery was to identify the top 1/3 of the applicant pool. Today the purpose of the DAT is to eliminate the bottom 1/5 of the applicant pool. This is due primarily to the fact that in the mid 1970's there were more than three times the number of applicants taking the DAT as there were first-year places available in dental schools. However, over the last 12 years there has been a precipitous decline in the number of students applying to dental schools; until now there is about a 1.2 to 1 ratio between the number of applicants taking the DAT and the number of first year places in dental schools.
This sharp decline in the number of applicants has radically altered the focus of the DAT tests. This change not only required a shift in the test development procedures to reflect the changing decision points of the tests, but also required that admissions committees be provided with more detailed information about the test taking experience to learn why the candidate may have scored at the lower range of the score distribution.
A mistake in classification when the decision point is at the upper 2/3 of the score distribution will probably not result in a serious mistake in terms of the academic preparation of the candidates. However, when the decision point is at the lower 1/5 of the score distribution a similar misclassification could result in a person who randomly guessed at all items on the test being admitted over a more qualified candidate. Supplemental Score Reports are designed to enable testing agencies to guard against such misclassification.
What Score Reports Tell Us
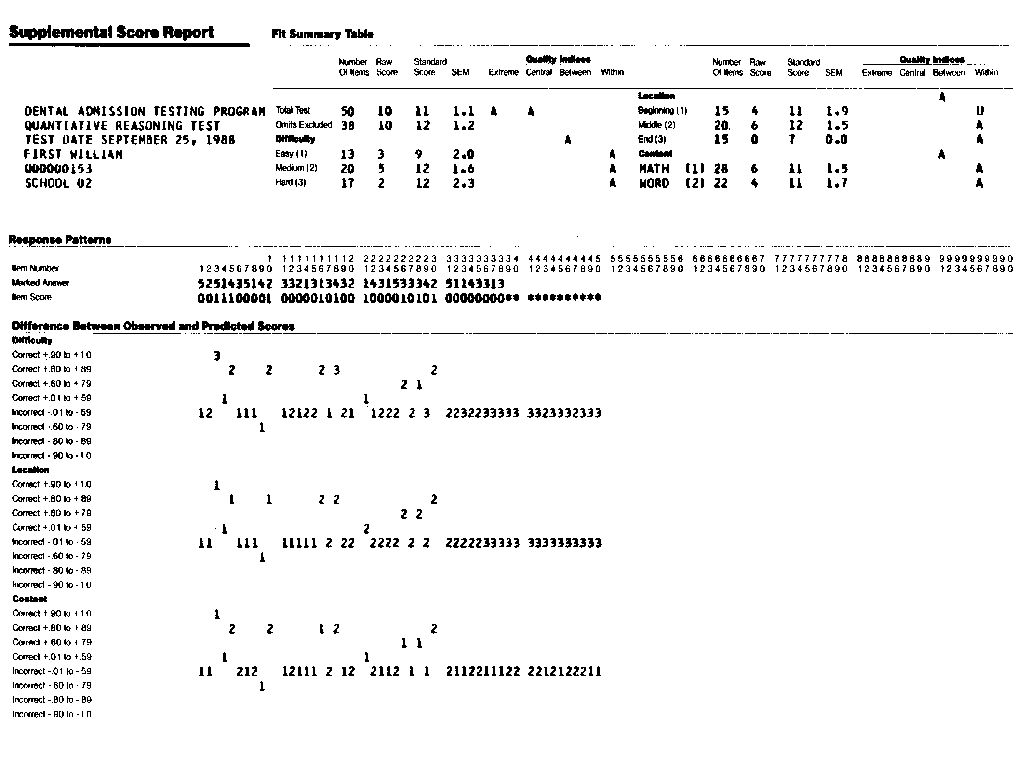
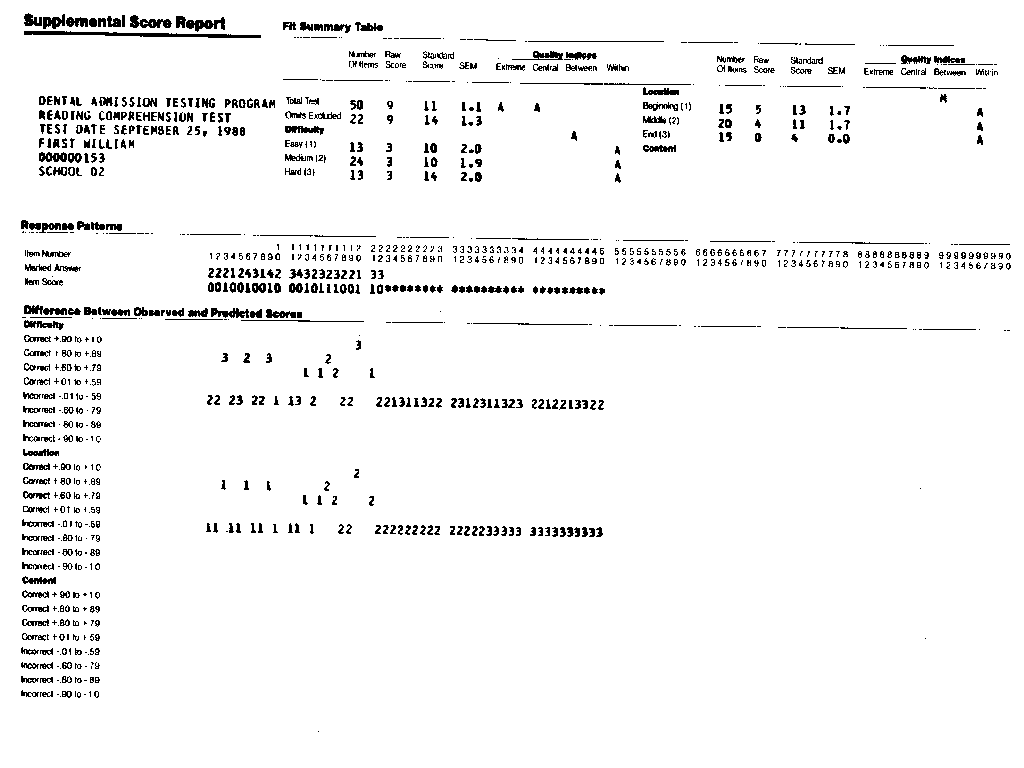
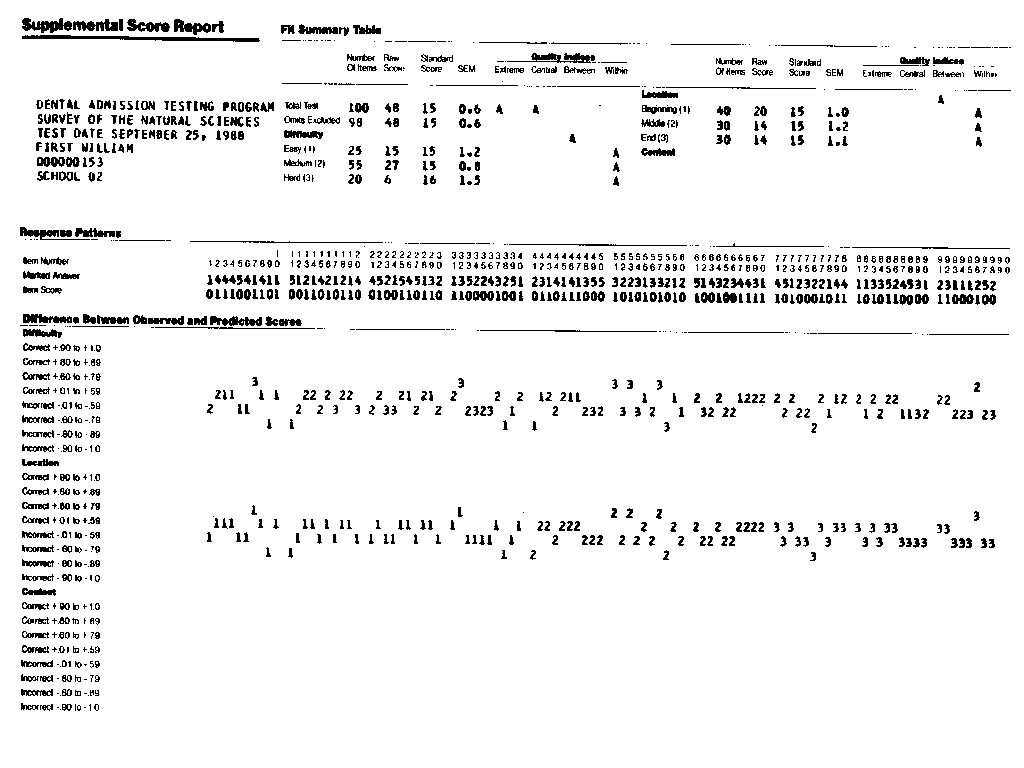
Examples of the Supplemental Score Reports are shown in Figures 1-5. The DAT consists of four tests, Quantitative Reasoning (50 items), Reading Comprehension (50 items) Survey of the Natural Sciences (100 items), and Perceptual Ability (75) items. The first four SSRs are an example of the results for the four different tests for one examinee.
The items on each test are classified by two or three different criteria to provide the opportunity to compare an applicants performance within the test but across the different classifications. In Quantitative Reasoning, the content classifications are based on the difficulty of the items (hard, medium, and easy) the location on the test (beginning, middle, and end) and the content of the problem (math or word problems).
Fit Summary Table
Under the Fit Summary Table at the top center of the SSR, overall test information is provided, including total number of items, raw score, standard score (1 to 30) and the standard error of measure on the standard score scale for both the total test and the total number of items that the examinee has attempted. When the examinee has attempted all items these two lines will be the same. In the case of William First, shown in the first SSR, the omits excluded line shows that only 38 of the 50 items were attempted.
The extreme and central quality indices shown to the right of the total test line are the unweighted and weighted versions of the person total fit statistic (Wright and Stone, 1979). These indices have been assigned three values to assist in interpretation, A for acceptable (t<1.5), M for marginal (1.5<t<2.0), and U for unacceptable (t>2.0).
Between Item-Group Analyses
The first of the three between item group analyses is listed below. The first, "Difficulty", compares William's performance on the 13 easy items with the 20 medium difficulty items and the 17 hard items. The different standard score for these three sets are within two standard errors and the between fit statistic for this comparison is acceptable (A). All of the between item group comparisons are based on all of the items on the test, not just the items that the examinee attempted.
The top of the second column in the Fit Summary Table shows the result of the "Location" analysis, the examinee's results on the first 15 items on the test compared to the middle 20 and the last 15. Since William did not have any right among the last 15 items, it is impossible to estimate his ability or standard error of measure on those items. Instead, an ability which is one standard error less than the ability for 1 item correct is assigned to provide a point of reference. The standard error is set to zero to remind us that this ability estimate is not of the usual kind.
The within quality indices provided for each sub group in the between group comparison are the unweighted total fit statistic calculated for just the items in that subgroup. The within fit statistic uses the ability estimate for the subgroup to calculate the probability of a correct response not the total test ability.
The "Content" classification, which appears only on the Quantitative Reasoning and Perceptual Ability tests, is based on the content of the items. On the Quantitative Reasoning test 28 of the items are math problems and 22 of the items are word problems.
Response Pattern Information
The lower two thirds of the SSR provide response pattern information. The item numbers are listed across the top in vertical format and in ten item groups. The next line lists the examinee's actual response and the next line shows the scored response ( 0 = incorrect, 1 = correct, and * = omit). The pattern indicates that this examinee did not attempt the last 12 items on the test.
The final three panels show the item residuals for each item. The item residual is the difference between the observed response and the probability of a correct response. Items answered correctly will have a positive residual and items answered incorrectly will have a negative residual. The distance the residual lies above or below the center two lines represents the degree of disparity between the observed response and the probability of a correct response and can be thought of as an index of the amount of surprise in the observed response. This examinee answered item number 3 correctly even though he had less than a .1 probability of doing so. The majority of the incorrect residuals are unsurprising because they are all items that he had less than a .4 probability of answering correctly.
The item residuals are plotted three times. The magnitude of the residual remains the same only the number plotted changes to show to which item subgroup the item belongs. The three numbers plotted for the third item indicate that (1) it is one of the hard items thus the "3" under "difficulty"; (2) it is one of the beginning items, thus the "1" under "location"; (3) the item is a math problem, thus the "1" under "content".
Unfinished Tests
In reviewing the four SSRs for William First you should notice that, although the quality indices are generally acceptable, he did not finish three of the four tests in the battery. His failure to finish the tests resulted in the marginal (M) "location" between quality index for the Reading Comprehension test and the unacceptable (U) "content" between quality index for the Perceptual Ability test. Here he also omitted one entire item type in the middle of the test, the Cube items that are labeled "4" in the "content" residual plot. The consistency of omitted responses, particularly on a test with no guessing correction that specifically instructs all examinees to be sure to fill in a response to every item, suggests a lack of test-wiseness.
Unwanted Response Behavior
The remaining two SSRs are both from the Quantitative Reasoning Test. Susan Second is a case with an unacceptable (U) difficulty between quality index. This is due primarily to her low ability estimate on the middle difficulty items. There is an eight standard score difference between the ability estimates that have a SEM of about 2. The large residuals at the end of her response pattern may be due to guessing, since a review of her answers indicates that she responded with a "3" for items 37 to 46. Perhaps she ran out of time just as the William First but filled in "3" rather than leaving the items blank. What ever the reason, it is difficult to believe that she really attempted the last 14 items.
Differential Performance Indications
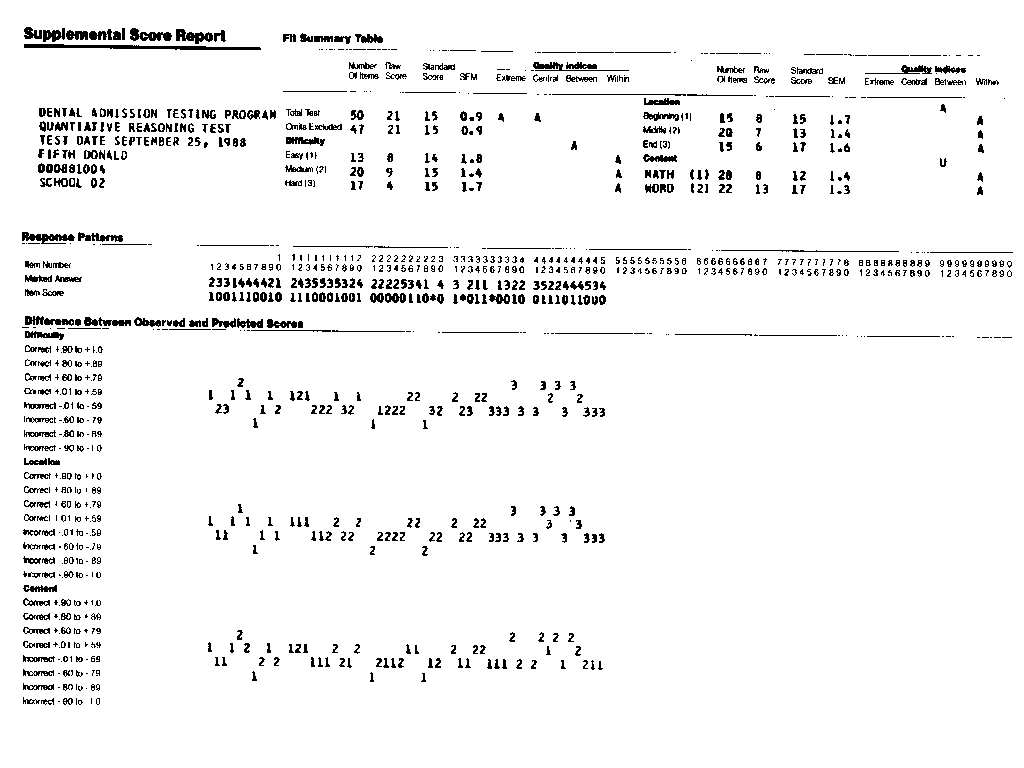
The final SSR for Donald Fifth shows an unacceptable between quality index for "content". In this case Donald answered a considerably higher proportion of the word problems correctly and had a standard score 5 points higher on the "word" problems than on the "math" problems. This can also be seen in the "content" residual plot with the 5 large residuals labeled "2". The most interesting question is which of the standard scores, the total test 15, the "math" problem 12 or the "word" problem 17 represents his ability. If the word problems are a better predictor of success in the dental school curriculum, then one might make a different admissions decision than if the "math" problems were a better predictor of success.
You may have this Problem!
One of the surprising things about this type of analysis is the extent to which measurement disturbances are present in the data. A review of 1000 SSRs from the April 1987 administration of the Quantitative Reasoning Test showed that 53% of the persons taking the test exhibited some type of inconsistent behavior. 19% of the individuals did not finish the test and either filled in the same response, e.g., fifteen "3"s or left the fifteen items blank, 8% seemed to be entering random responses for at least 10 items, 14% had unacceptable between quality indices for "content", 5% exhibited start-up mistakes, 3% exhibited carelessness and 5% had inconsistent patterns based on location, e.g., they did very poorly in the middle of the test.
Richard M Smith & Gene A Kramer
Wright B.D. & Panchapakesan N. 1969. A procedure for sample- free item analysis. Educational and Psychological Measurement, 29, 23-48.
Response pattern analysis with Supplemental Score Reports. Smith RM, Kramer GA. … Rasch Measurement Transactions 2:4 p.33-40

|
| Figure 1. First William - Quantitative Reasoning Test |

|
| Figure 2. First William - Reading Comprehension Test |

|
| Figure 3. First William - Survey of the Natural Sciences |

|
| Figure 4. First William - Perceptual Ability Test |

|
| Figure 5. Second Susan - Quantitative Reasoning Test |

|
| Figure 6. Fifth Donald - Quantitative Reasoning Test |
Response pattern analysis with Supplemental Score Reports. Smith RM, Kramer GA. … Rasch Measurement Transactions, 1989, 2:4 p.33-40
| Forum | Rasch Measurement Forum to discuss any Rasch-related topic |
Go to Top of Page
Go to index of all Rasch Measurement Transactions
AERA members: Join the Rasch Measurement SIG and receive the printed version of RMT
Some back issues of RMT are available as bound volumes
Subscribe to Journal of Applied Measurement
Go to Institute for Objective Measurement Home Page. The Rasch Measurement SIG (AERA) thanks the Institute for Objective Measurement for inviting the publication of Rasch Measurement Transactions on the Institute's website, www.rasch.org.
| Coming Rasch-related Events | |
|---|---|
| Jan. 16 - Feb. 13, 2025, Fri.-Fri. | On-line workshop: Rasch Measurement - Core Topics (E. Smith, Winsteps), www.statistics.com |
| Apr. 8 - Apr. 11, 2026, Wed.-Sat. | National Council for Measurement in Education - Los Angeles, CA, ncme.org/events/2026-annual-meeting |
| Apr. 8 - Apr. 12, 2026, Wed.-Sun. | American Educational Research Association - Los Angeles, CA, www.aera.net/AERA2026 |
| May. 15 - June 12, 2026, Fri.-Fri. | On-line workshop: Rasch Measurement - Core Topics (E. Smith, Winsteps), www.statistics.com |
| June 19 - July 25, 2026, Fri.-Sat. | On-line workshop: Rasch Measurement - Further Topics (E. Smith, Winsteps), www.statistics.com |
The URL of this page is www.rasch.org/rmt/rmt24a.htm
Website: www.rasch.org/rmt/contents.htm