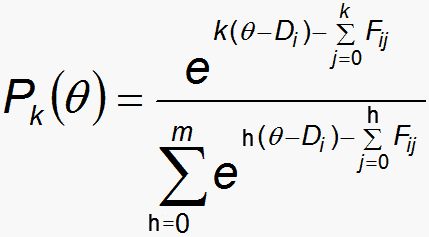
Huynh & Mayer (2003) present some useful findings regarding the statistical information provided by ordered categories. Their work suggests a further device for identifying the location of categories on the latent variable.
Let θ be a location on the latent variable relative to the item difficulty (defined as the point on the latent variable at which the highest and lowest categories are equally probable to be observed). Pk(θ) is the probability of observing category k at location θ.

| (1) |
where θ is the location on the latent variable; Di is the "difficulty" location of item i on the latent variable; k=0,m are the m+1 categories of the dichotomy or polytomy; Fij are the m Rasch-Andrich thresholds of the polytomous structure (rating scale, partial credit) associated with item i, and Fi0 = 0 (or any convenient value).
Then, the expected value of the observation at θ is E(θ) where|
| (2) |
Across all values of θ, E(θ) is the model ICC (item characteristic curve, item response function).
Let I(θ) be the Fisher information in an item measure at location θ. Then I(θ) across all values of θ is the item information function. This is the slope of the item characteristic curve, the item's model variance, at each location θ.
|
| (3) |
and let S(θ) be the skewness of the item at θ, so that
|
| (4) |
Then I(θ)Pk(θ) is the information that can be attributed to category k at θ. For every category, its measure information at the extremes of the latent variable is asymptotically zero. At some point or points along the latent variable the information peaks. At a maximum, the differential of the category information is zero, i.e., where:
|
| (5) |
In general,
|
| (6) |
|
| (7) |
|
| (8) |
|
| (9) |
so that category information maxima (and minima) occur where
|
| (10) |
Contrast this with the parallel expression for where the category probability maxima occur:
|
| (11) |
An advantage of the category information approach is that it identifies locations for the maximum information of the extreme categories, while such locations do not exist for the maximum probabilities of extreme categories.
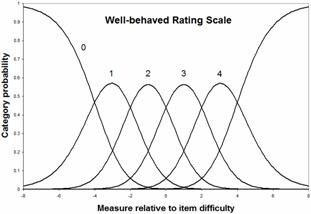 |
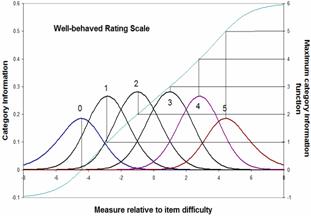 |
Here are the category probabilities, category information and maximum information curve for a well-behaved polytomous item. The maximum information for the extreme categories occurs, in this example, at ±4.4 logits where the extreme categories have a probability of 0.6. The measures are more central, and the probabilities are lower than other approaches suggest. For instance, the measure corresponding to a probability of 0.75 for the extreme categories is ±5.1 logits.
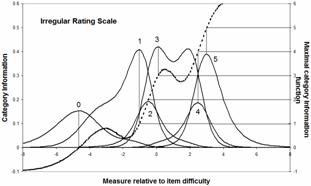 |
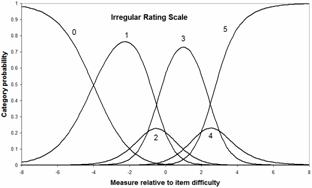 |
For a less well-behaved rating scale with uneven category probabilities, the information function is more complex, and can have multiple maxima for one category. In this irregular example, the probability of the lowest category at the location of maximum information. -4.6 logits is only .64. For the highest category, it is at 3.9 logits where the category probability is .83.
John Michael Linacre
Huynh H. & Meyer P.L. (2003) Maximum information approach to scale description for affective measures based on the Rasch model. Journal of Applied Measurement, 4, 2, 1010-110.
Dichotomous & Polytomous Category Information, Linacre J.M. … Rasch Measurement Transactions, 2005, 19:1 p. 1005-6
| Forum | Rasch Measurement Forum to discuss any Rasch-related topic |
Go to Top of Page
Go to index of all Rasch Measurement Transactions
AERA members: Join the Rasch Measurement SIG and receive the printed version of RMT
Some back issues of RMT are available as bound volumes
Subscribe to Journal of Applied Measurement
Go to Institute for Objective Measurement Home Page. The Rasch Measurement SIG (AERA) thanks the Institute for Objective Measurement for inviting the publication of Rasch Measurement Transactions on the Institute's website, www.rasch.org.
| Coming Rasch-related Events | |
|---|---|
| Jan. 16 - Feb. 13, 2025, Fri.-Fri. | On-line workshop: Rasch Measurement - Core Topics (E. Smith, Winsteps), www.statistics.com |
| Apr. 8 - Apr. 11, 2026, Wed.-Sat. | National Council for Measurement in Education - Los Angeles, CA, ncme.org/events/2026-annual-meeting |
| Apr. 8 - Apr. 12, 2026, Wed.-Sun. | American Educational Research Association - Los Angeles, CA, www.aera.net/AERA2026 |
| May. 15 - June 12, 2026, Fri.-Fri. | On-line workshop: Rasch Measurement - Core Topics (E. Smith, Winsteps), www.statistics.com |
| June 19 - July 25, 2026, Fri.-Sat. | On-line workshop: Rasch Measurement - Further Topics (E. Smith, Winsteps), www.statistics.com |
The URL of this page is www.rasch.org/rmt/rmt191a.htm
Website: www.rasch.org/rmt/contents.htm