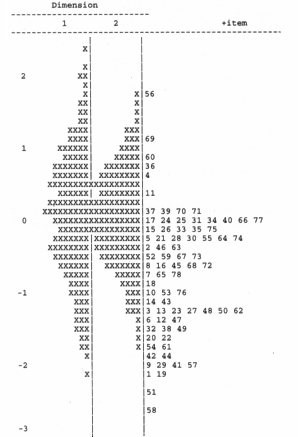
The physical universe is imagined to exist in 11 dimensions (and time) according to "string" or "(mem)brane" theory. Only three of these dimensions, length, depth, width, do we encounter directly. Very few can understand this complexity. But the mental universe of everyday experience is of a far higher dimensionality, and we encounter many of its dimensions simultaneously intertwined. Consider Figure 1 (excerpted from Figure 1 in De Mars C.E., "Measuring Higher Education Outcomes with a Multidimensional Rasch Model", Journal of Applied Measurement, 5, 4, 350-361, 2004).
Figure 1 shows student measures on two dimensions. Dimension 1 depicts the measures for the students on "American Experience" objectives and Dimension 2 on "Global Experience" objectives. Items 1-40 focus on American Experience and 41-78 on Global Experience.

Figure 1. Experience map in one dimension (DeMars, 2004)
The Paper reports the reliabilities of the student measures in the two dimensions of "Experience" to be .86 and .76, and the correlation between the student measures from separate analyses of the dimensions to be .64. This implies that the correlation between the dimensions, when disattenuated for measurement error, is .64 /?(.86*.76) = 0.78. This approximates 0.79, the correlation between the two dimensions in the joint multidimensional analysis. Thus analyzing the two Experiences together increases overall estimation accuracy. However, the accuracy for those students with atypical relationships between the dimensions may be reduced.
In wrestling with dimensional concepts, it is useful to consider parallel situations in physics. The two "Experience" variables are correlated .79. This is roughly the correlation of height and weight for growing children. So, looking at Figure 1 we could understand Dimension 1 to be height, and Dimension 2 to be weight. And items 1-40 to be marks on a height scale, and items 41-78 to be marks on a weight scale. When we don't know a child's weight, or measure it too sloppily, we can infer that weight from the child's height, and vice-versa. In fact, no matter how precisely we estimate a child's weight, the child's height estimate would indicate whether our weight estimate is on the heavy side (if the child is relatively short) or on the light side (if the child is relatively tall) and similarly for the child's height estimate. Further, our height and weight scales may be crude or uneven. In which case, the correlation between height and weight enables us to smooth out some of the irregularity in the scale markings. But, though these manipulations produce an overall improvement in accuracy, the accuracy for any particular child might be lessened.
On the map, however, these operational considerations, and the non-orthogonality of height and weight in our sample, must be left behind. There are two dimensions, so, to understand these data, a two dimensional map is needed. Figure 2 is Figure 1 redrawn with student locations simulated to match the distributions in Figure 1.

Figure 2. Experience map in two dimensions
On viewing Figure 2, an immediate question is, "Which students have substantively or statistically significantly different measures on the two dimensions?" Substantively, in many educational situations, one logit approximates one year of growth. Statistically, in the multi-dimensional analysis, the two sets of measures (and their standard errors) are not independent, so drawing confidence bands on Figure 2 is awkward. However those students whose two measures differ by more than a logit are statistically, and probably substantively, irregular.
John Michael Linacre
Mapping multidimensionality, DeMars C, Linacre J … Rasch Measurement Transactions, 2004, 18:3 p. 9990-991
| Forum | Rasch Measurement Forum to discuss any Rasch-related topic |
Go to Top of Page
Go to index of all Rasch Measurement Transactions
AERA members: Join the Rasch Measurement SIG and receive the printed version of RMT
Some back issues of RMT are available as bound volumes
Subscribe to Journal of Applied Measurement
Go to Institute for Objective Measurement Home Page. The Rasch Measurement SIG (AERA) thanks the Institute for Objective Measurement for inviting the publication of Rasch Measurement Transactions on the Institute's website, www.rasch.org.
| Coming Rasch-related Events | |
|---|---|
| Jan. 16 - Feb. 13, 2025, Fri.-Fri. | On-line workshop: Rasch Measurement - Core Topics (E. Smith, Winsteps), www.statistics.com |
| Apr. 8 - Apr. 11, 2026, Wed.-Sat. | National Council for Measurement in Education - Los Angeles, CA, ncme.org/events/2026-annual-meeting |
| Apr. 8 - Apr. 12, 2026, Wed.-Sun. | American Educational Research Association - Los Angeles, CA, www.aera.net/AERA2026 |
| May. 15 - June 12, 2026, Fri.-Fri. | On-line workshop: Rasch Measurement - Core Topics (E. Smith, Winsteps), www.statistics.com |
| June 19 - July 25, 2026, Fri.-Sat. | On-line workshop: Rasch Measurement - Further Topics (E. Smith, Winsteps), www.statistics.com |
The URL of this page is www.rasch.org/rmt/rmt183j.htm
Website: www.rasch.org/rmt/contents.htm