To attempt to set a standard is to plunge into a welter of confusing uncertainties, to become mired in ethics and politics, to be forced into resolutions of irreconcilable ambiguities. Nevertheless we do it. I have no remedy for the qualitative enigmas. I do have a suggestion for simplifying the quantitative side. Here is my recipe for the statistical part of setting standards. [Another attempt at objective standard setting is the Lewis, Mitzel, Green (1996) IRT-based Bookmark standard-setting procedure.]
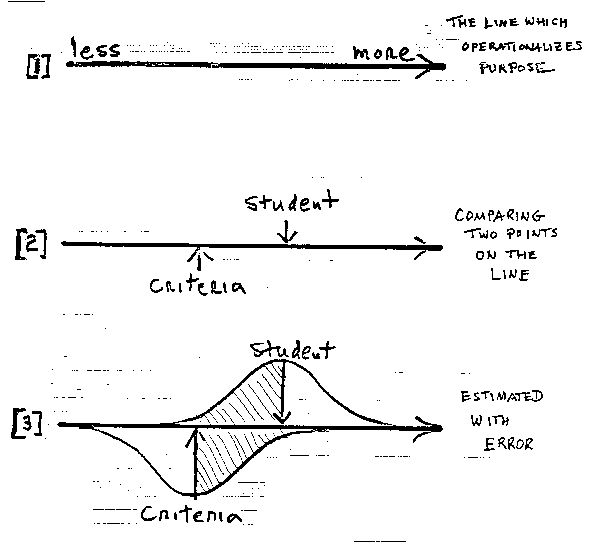
We cannot set a standard unless we decide what we want, what is good, what is not, what is more, what is less. We must set-up a line of increasing amounts, a variable which operationalizes what we are looking for [see 1]. Usually this variable is brought to life by a test. Then, it is the calibrations of the test's items which define the line and the measures of the test-takers which show us who is more and who is less and help us to decide how much is enough.
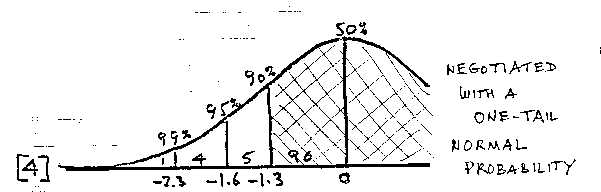
Setting standards, requires comparing two points on our line [see 2]. One point is the measure of the student. The other is our standard, our criteria. The locations of these points, however, are always uncertain [see 3] . The best we can do is to estimate them with some, hopefully estimable, error.
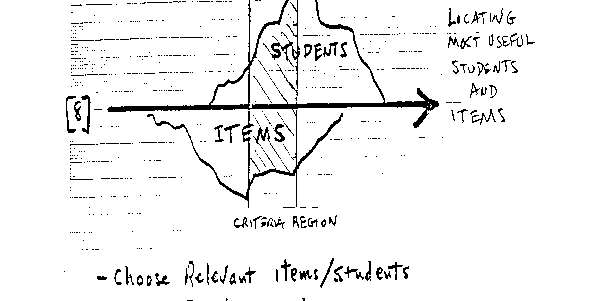
Fortunately, 260 years of theory and experience give us a practical way to negotiate this uncertainty. We can use the shape of the normal distribution to qualify our decisions with reasonable levels of confidence [see 4]. If we locate a boundary 1.6 standard errors below a student's point estimate, we leave above us 95% of the reasonable-to-expect locations of the uncertain point. Speaking from our new location it is reasonable to claim 95% confidence that the student is above this lower boundary.
To put this way of dealing with uncertainty into practice we make a habit of bracketing each point estimate of a measure, whether it be student, item or criteria by ±1.6 Standard Errors [see 5]. This marks the end points at which we can have 95% confidence in decisions in one direction or the other.
As long as the student region and the criteria region do not overlap, a pass/fail decision is clear. But when they do overlap, we can seem to be in trouble. Were we to accept this overlap as final, we would be stuck with a group of students for whom no clear pass/fail decision is possible.
Fortunately there is a fair way out. There is a natural asymmetry inherent in standard setting. We seldom make decisions in both directions at once. There little call both to guarantee quality and also to protect innocence simultaneously.
When we certify competence, our call is to guarantee quality. In that case we need be confident only that the student is above our criteria. Otherwise the student does not pass [see 6].
When, on the other hand, our call is to protect innocence. Then we need be confident only that the student is below our criteria. Otherwise the student does not fail [see 7].
So much for how to compare two uncertain points and yet reach a confident decision. We know how to locate the student point. The student takes a test of items which define the line and the student's test performance is used to estimate a measure and its error. But what about the criteria? What can we do to locate a convincing criteria on the line of the standard setting variable on which our students are measured?
There are two, and, as far as I can see, only two, ways by which we can communicate with the standard setting variable through the calibrations of its defining items and through the measures of its tested students. To find the particular items and students which will be most useful, we examine the distributions of item calibrations and student measures along the line of the variable. This shows us which items and students are near the region where we expect the criteria. These are the items and students most relevant to criteria realization [see 8].
Next we get a panel of experienced judges and ask each judge independently to examine some of the selected item texts and/or some of the selected student performances and histories, and then to rate each item and/or student on a scale like:
| For Items: | Definitely Required | Don't Know | Definitely NOT |
| For Students: | Clearly Qualified | Can't Tell | Clearly NOT |
| Which we Score: | 2 | 1 | 0 |
When we have enough responses from enough judges to compose a data matrix of judge-by-item and judge-by-student ratings, we Rasch analyze these matrices, separately or together, to locate a coherent nucleus of agreement on the definition of a criteria. The judge mean is set at zero. As we proceed, we will undoubtedly uncover judges who are inconsistent and may need to be retrained or retired, and items and students which have proven confusing to the judges. We will also encounter items and students with judge ratings out of line with their test locations along the variable.
These misfits contradict the intention of our work and raise doubts about our ability to locate a criteria with these particular judges, items and students. But we must not capitulate prematurely. The reasonable thing to do is to set the misfits aside for the time being and proceed along the main line. Then we return to the misfits before we finish up in order to understand what they tell us about the hazards of setting standards in this situation.
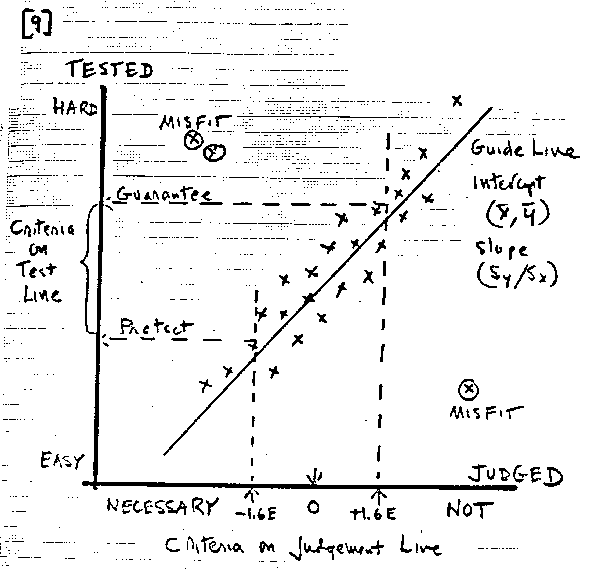
When a sensible and usable definition of a criterion is found among the judges ratings, its Rasch calibration provides a measure for each item and each student. The last step is to plot these judged measures against their matching tested measures: the calibrations and measures from test results [see 9].
Once we have the plot, it will undoubtedly be necessary, before proceeding, to edit the plot for outliers, that is by setting aside points in preposterous locations like the three circled. These are items and students for whom there is serious contradiction between judged and tested results. If they are few, it is reasonable to proceed without them. But we will not feel confident in our work until we can explain these outliers.
Evaluating the coherence of the plot is expedited by adding a least squares guideline through the points. The path of this line is given by an intercept through the means of the Judged and Tested points (Mjudged, Mtested) and a slope of (SDtested/SDjudged).
The zero on the horizontal Judged Axis locates the mean criteria point for these judges. We bracket this with ±1.6 standard errors and extend a line up from each edge of the bracket. When a rising line surpasses the guideline, we turn the line 90 degrees to the left and extend it horizontally to intercept the vertical Tested Axis. These intercepts locate criteria points on the line of Test Measures. The points may be adjusted upward to the mastery level required by the standard setting agency. The upper point is the Guarantee Criteria. The lower point is the Protection Criteria.
Progress depends on forcing data to serve our intentions. It is foolish to include data in an analysis which contradicts expectation. It is also foolish to ignore misfits. Each time we remove misfits in order to better approximate our expectations we must also seek explanation. Each misfit understood is an education to better science. Each misfit left mysterious is a symptom of confusion.
The virtues of my recipe for setting standards are:
1. The steps are simple, straightforward and always the same.
2. All relevant data are put to work.
3. No irrelevant variables are mixed in.
4. The work is done with pictures. Results are seen at a glance.
Benjamin D. Wright
First presented at the 15th Mid-Western Educational Research Association Annual Meeting, Chicago, October 14, 1993.
How to set standards. Wright B.D. … Rasch Measurement Transactions, 2000, 14:1 p.740
| Forum | Rasch Measurement Forum to discuss any Rasch-related topic |
Go to Top of Page
Go to index of all Rasch Measurement Transactions
AERA members: Join the Rasch Measurement SIG and receive the printed version of RMT
Some back issues of RMT are available as bound volumes
Subscribe to Journal of Applied Measurement
Go to Institute for Objective Measurement Home Page. The Rasch Measurement SIG (AERA) thanks the Institute for Objective Measurement for inviting the publication of Rasch Measurement Transactions on the Institute's website, www.rasch.org.
| Coming Rasch-related Events | |
|---|---|
| May. 15 - June 12, 2026, Fri.-Fri. | On-line workshop: Rasch Measurement - Core Topics (E. Smith, Winsteps), www.statistics.com |
| June 19 - July 25, 2026, Fri.-Sat. | On-line workshop: Rasch Measurement - Further Topics (E. Smith, Winsteps), www.statistics.com |
| Aug. 31 - Sept 2 2026, Mon.-Wed. | In person: IMEKO TC1 Metrology Education and Training symposium, Klagenfurt, Austria www.photomet-edumet2026.com. Submissions by April 20 |
| Aug. 30 - Sept. 3, 2027, Mon.-Fri. | In Person: 2027 IMEKO World Congress (TC1, Tc7, TC13, TC18, TC26), Rimini, Italy imeko2027.org |
The URL of this page is www.rasch.org/rmt/rmt141n.htm
Website: www.rasch.org/rmt/contents.htm