Category disordering occurs when the ordinal numbering of categories does not accord with their substantive meaning. Consider the 7 level FIMTM rating scale. Each level is substantively defined to represent a higher level of functioning. The ordinal numbering accords with this. But what would happen if the numbering of two categories was reversed? Then a higher category number could correspond to a lower level of functioning. The categories would be substantively disordered.

|

|

|

|

|

|

|

|

|
| FIM Level |
Count | Average Measure |
INFIT MNSQ |
OUTFIT MNSQ |
Step calibration Rasch-Andrich threshold |
| 1 2 3 4 5 6 7 |
96 88 101 168 210 146 101 |
-2.80 -2.04 -1.02 -.27 .85 2.34 3.32 |
.98 .75 1.07 1.03 1.01 .75 .87 |
1.02 .80 1.03 1.19 .91 .83 .89 |
NONE -2.22 -1.70 -1.31 .08 2.02 3.14 |
| Table 1. Satisfactory Category Statistics Average measures advance, Thresholds advance, MNSQs near 1.0 | |||||
Here are the category summary statistics in Table 1 for some patient records with correctly coded FIM levels. Note that the "Average Measure" values advance with category. These indicate that, for this sample, higher patient performance corresponds to higher categories. The category mean-square fit statistics also do not markedly exceed their model values of 1.0. Figure 1 shows the modeled category probability curves. They depict the expected succession of "hills".
| FIM Level |
Count | Average Measure |
INFIT MNSQ |
OUTFIT MNSQ |
Step calibration Rasch-Andrich threshold |
| 1 (2) 2 (1) 3 4 5 6 7 |
88 96 101 168 210 146 101 |
-1.97 -2.18 -.95 -.25 .80 2.14 3.02 |
1.47 .54 1.05 .91 .97 .66 .83 |
1.41 .69 1.02 .99 .87 .75 .86 |
NONE -2.08 -1.49 -1.24 .08 1.87 2.86 |
| Table 2. Category Disordering Average measures disordered, MNSQs misfit > 1.0, but Thresholds advance | |||||
Now, suppose that due to a coding or data entry error, the numbering of levels 1 and 2 was reversed, introducing substantive category disordering. Table 2 shows the resultant category statistics. The observed category counts verify that category 1 and 2 have been reversed. Now the "average measure" values for categories 1 and 2 are disordered, and category 1 is exhibiting large misfit. Counter-intuitively, the step calibrations are ordered. The modeled category probability curves, shown in Figure 2, still depict a succession of "hills". This is because the measures, the Rasch model parameters, are always estimated on the basis that the data fit the model.
Substantive disordering of the categories is flagged by disordering in the "average measure" values and mean-square fit statistics much larger than 1.0 (indicating misfit), not disordering in the step calibrations nor in the shape of the probability curves. Of course, these statistics comment on the functioning of the rating scale for this sample. Whether substantive category disordering is due to a misspecification of the rating scale or to idiosyncrasies only found in the sample requires further investigation.
Step (Threshold) Disordering
The step calibrations or Rasch/Andrich thresholds correspond to the Rasch model parameters for the rating scale structure. Each step calibration parameterizes the relationship between a pair of adjacent categories. If, for a given item targeted directly at the person's ability level, a step calibration has a positive value, then the lower of the pair of categories is more likely to be observed. If the step calibration has a negative value, then the higher category of the pair is more likely to be observed.
Rating scale categories, however, are not observed in pairs but in the entire set simultaneously. This complicates their interpretation. If the step calibrations become successively more positive as category number increases (as in the FIM examples), then the plot of the category probability curves depicts a "range of hills". Each category in turn is most probable to be observed, and the intersections of the modal categories correspond to the step calibrations.
If the step calibrations do not increase monotonically with category number, i.e., are disordered, then one or more categories are never modal, and one or more "hill tops" are missing from the range of hills.
| FIM Level |
Count | Average Measure |
INFIT MNSQ |
OUTFIT MNSQ |
Step calibration Rasch-Andrich threshold |
| 1 2 3 4 5 6 7 |
96 44 101 168 210 146 101 |
-2.81 -1.96 -1.03 -.30 .82 2.30 3.27 |
.90 .88 1.02 1.07 .96 .75 .87 |
.96 .92 .98 1.22 .88 .82 .89 |
NONE -1.49 -2.33 -1.29 .05 1.97 3.09 |
| Table 3. Low Frequency in Category 2 Thresholds disordered, but average measures advance, MNSQs near 1.0 | |||||
An Example of Step Disordering
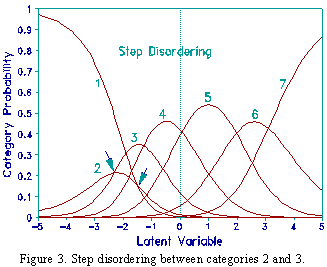
To illustrate this, consider the FIM data presented above, but with every other observation of level 2 made missing. Table 3 shows the resulting category statistics. Compare these with Table 1. The count for level 2 is reduced by 50%. The step calibration from level 2 to 3, -2.33, is now less than that from level 1 to 2, -1.49, and so is disordered. As shown in Figure 3, category 2 is no longer modal. The cross-over between the curves for levels 2 and 3 (i.e., the step calibration) is to the left of that for levels 1 and 2. The crossover points are disordered. All other statistics, however, are almost identical. Step disordering has not introduced category disordering (as diagnosed by average measures) nor category misfit (as diagnosed by fit mean-squares).
Step Calibrations and Modality
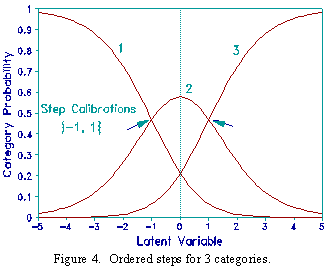
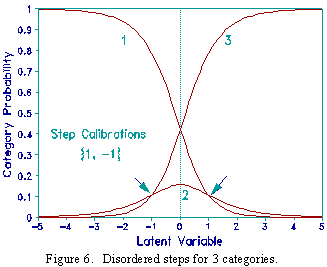
What is the relationship between step calibrations and modality? Consider a 3 category rating scale. In Figure 4 the steps are ordered. In Figure 5 the steps coincide. The maximum probability of the central category is .33. In Figure 6 the steps are disordered. For 3 categories, the relationship between the two step calibrations, F1 and F2, and the maximum probability of the central category, as plotted in Figure 7, is given by the ogive:

Step Calibrations and the Latent Variable
From the perspective of Cumulative Probabilities, i.e., Thurstone Thresholds as computed according to the Rasch model, (Figure 8), as the step calibrations become more disordered, the central category becomes narrower. Step disordering does not indicate that the category definitions are out of sequence, rather that the category defines a narrow section of the variable. Empirically, disordered step calibrations may indicate that the category definition is too narrow, or that too many category options have been presented to respondents. Consequently, combining the narrow category with an adjacent category may simplify use of the rating scale or assist with communication of conclusions based on the scale.
Step disordering Increases Item Discrimination
Expected score ogives (the model item characteristic curves shown in Figure 9) are steeper with disordered steps. Thus step disordering indicates an item that is highly discriminating over a limited region of the variable, but that is less informative in other regions. Thus "high item discrimination" is not synonymous with "better functioning" or "more effective".
John M. Linacre